


You share a feedback survey in your customer community. The regulars respond, the comments are detailed, and the roadmap suddenly looks obvious.
Then someone asks, “Did we hear from anyone who stopped using the product?” You check the list. Almost nobody.
Sampling bias occurs when the way a survey sample is selected systematically overrepresents or underrepresents people in ways that affect the result. For customer surveys, the fix starts before the first invitation: define whose experience you need, build a suitable customer list, and choose how people enter the sample.
Here is a practical way to do that without turning a small feedback project into a research department.
Sampling bias is not the same as a small sample
A fair random sample will vary from the population by chance. That is sampling variability. Systematically excluding customers who struggled to activate an account is a different problem. Adding more successful customers will not bring the excluded group back.
The Australian Bureau of Statistics distinguishes sampling and non-sampling errors. Its guidance is a useful reminder that a margin of sampling error does not describe every way a survey can go wrong.
We use “sampling bias” here for problems with who gets into the survey. Selection bias is the broader idea, including who remains in your analysis. Response bias concerns how the questions shape the answers.
How to avoid sampling bias: a six-step customer survey plan
1. Finish the sentence: “We want to understand…”
Be specific about people and time. “Customers who attempted onboarding in September” includes people who abandoned setup. “Customers who completed onboarding in September” does not. Either population can be appropriate; they answer different questions.
Also choose the unit. Are you measuring individual users, buying accounts, or transactions? One large account with 40 users should not accidentally count as 40 customers in a survey meant to represent companies.
2. Check the invitation list against that definition
Your sampling frame is the list you select from. A billing export, CRM segment, and active-user list can contain different people. Check exclusions before you click Send: cancellations, bounced emails, people without an account login, customers served offline, and accounts with several contacts.
Remove duplicates at the chosen unit. Record exclusions you cannot repair. Contact people only through channels you are entitled to use; completeness is not a reason to ignore their preferences.
3. Choose invitees before looking at their likely opinion
For a simple random invitation sample, assign each eligible unit a random value, freeze the values, sort, and select the planned number. Keep the original list and selection date. Do not replace an inconvenient selection with a favorite customer.
When important groups are small, use a planned stratified sample: divide eligible customers by a relevant characteristic, such as tenure, and select randomly within each group. Statistics Canada explains both methods. Random invitations improve selection, but voluntary response can still introduce differences afterward.
4. Make participation possible across the groups you selected
A survey that appears only after login misses people who cannot log in. A desktop-only experience can exclude phone users. An invitation sent while one region is asleep may get buried before work begins.
Use a short survey, test the actual mobile path, and allow a reasonable response window. If you provide another language or channel, check that the meaning and answer choices remain comparable. Keep the invitation neutral: “Tell us about your experience” leaves more room than “Tell us what you love.”
5. Check the respondent mix while the survey is open
Compare invitees and respondents on characteristics already known for the eligible population: tenure, plan, region, or transaction type. Choose variables connected to the experience you are studying. Matching every available demographic is not a substitute for thinking about the decision.
If one group is missing, follow up with eligible nonrespondents from that group using a planned, consistent approach. Do not simply keep the survey open until the headline score looks better.
6. Keep population estimates separate from diagnostic feedback
A customer interview that uncovers an accessibility problem can be valuable even when the person was not randomly selected. What it cannot establish is the proportion of all customers with that problem.
Label convenience feedback as such. Use it to generate hypotheses, investigate failures, and design follow-up research. Reserve broad percentage claims for a design and analysis that justify them.
Worked example: the overall score hides the customer mix
Suppose your customer base contains 1,000 eligible accounts. The following numbers are fictional and chosen to make the calculation easy to inspect.
| Group | Eligible accounts | Respondents | Satisfied respondents |
|---|---|---|---|
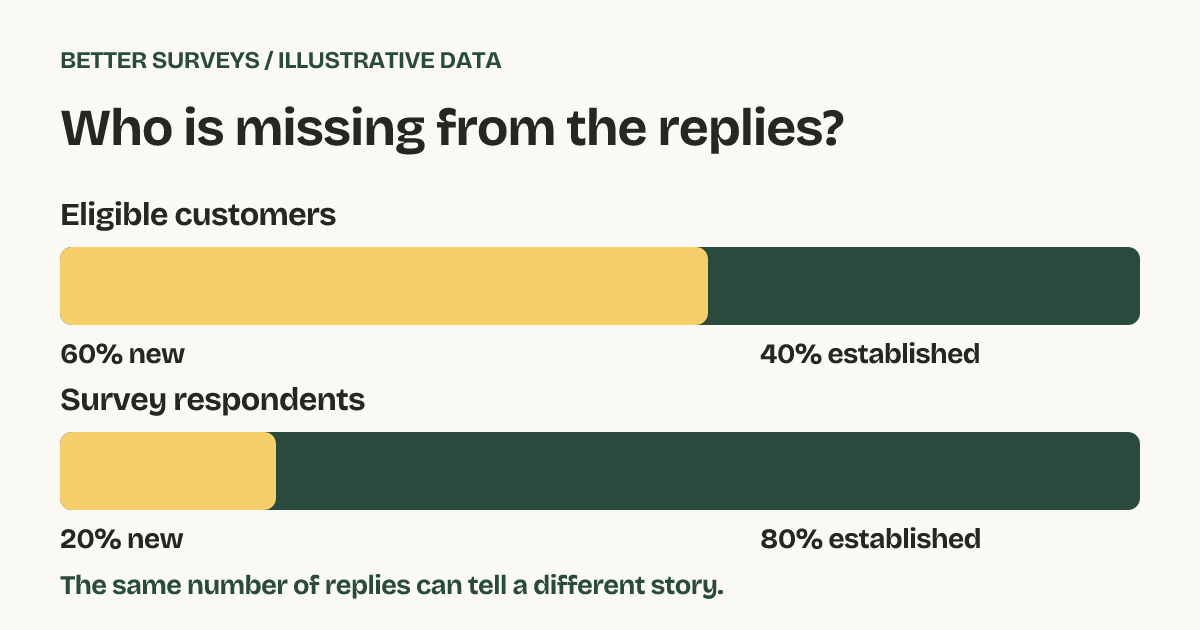
| New customers | 600 (60%) | 20 (20%) | 10 of 20 (50%) |
| Established customers | 400 (40%) | 80 (80%) | 72 of 80 (90%) |
| Total | 1,000 | 100 | 82 of 100 (82%) |
The unweighted result is 82% satisfied. Applying population shares to the two group rates gives (0.60 × 50%) + (0.40 × 90%) = 66%.
That 16-point difference shows how composition can matter. It does not prove that 66% is the true population figure: the 20 new-customer respondents might still differ from the 580 who did not respond. Weighting assumes that respondents adequately represent their group for the outcome being estimated. It also changes uncertainty and can make a few answers carry substantial influence.
For an operational team, the immediate action is straightforward: investigate the new-customer experience and collect better evidence from that group. Do not quietly replace 82% with 66% and call the problem solved.
A real example: ask the people who stopped using the service
Cityflo’s published Youform account describes separate rider surveys for NPS, churn, and festival planning. Sudhanshu Mishra, its SVP of Engineering and CISO, specifically mentions “a churn survey for riders who stop commuting.” Read Cityflo’s customer story.
The useful design choice is the distinction between current riders and people who stopped riding. A daily pulse from current riders cannot explain departure on its own. The story describes Cityflo’s workflow; it does not establish that either survey sample is representative.
Is there a response rate that makes a sample safe?
No single response-rate threshold establishes representativeness. In its 2017 study of telephone surveys, Pew Research Center found response rates around 9% alongside reasonably accurate estimates on many measures, but also identified weaknesses. Those were professionally designed telephone studies, not a benchmark for your customer survey.
The practical question is whether participation is related to what you are measuring. If unhappy new customers are less likely to answer, a healthy-looking overall rate can still hide the experience you need to understand.
A short survey-method note you can reuse
We invited [number] eligible [customers/accounts] who [eligibility rule] during [dates]. We selected them using [method]. We received [number] complete responses. [Group] was underrepresented compared with the eligible customer base. Results describe [scope]; they may not reflect [missing group].
In Youform, create the questionnaire using the online survey builder. Keep invitation records in your CRM or spreadsheet and compare them with your response export. The form collects answers; your invitation plan determines who has the opportunity to provide them.
Common sampling questions
Will a bigger sample remove sampling bias?
A larger sample can reduce random sampling variability under a suitable design. It cannot repair a missing segment or a recruitment channel that favors one experience.
Is inviting every customer better than sampling?
It removes the invitation-sampling step if the list covers the whole intended population. Coverage gaps and nonresponse can remain. Check who actually responds.
Can I use a sample-size calculator?
Yes, for planning under its stated assumptions. A sample-size calculator does not turn a voluntary community poll into a probability sample or account for every form of bias.
Your next step: before writing another question, compare your invitation list with the people whose decisions the survey is meant to inform. The most important missing answer may belong to someone who never saw the link.
Research and published customer account reviewed October 27, 2026. The weighting example is illustrative and is not Youform or Cityflo customer data.